Alternative Commodity Algorithmic Program (ACAP)
ACAP is a proprietary program developed by RTM Analytics. ACAP measures the performance of a program with a transparent long/short/flat methodology comprised of highly liquid US Exchange listed commodity futures. ACAP has demonstrated consistent non-correlated returns that are additive to a well-structured equity/fixed income portfolio in all economic environments.
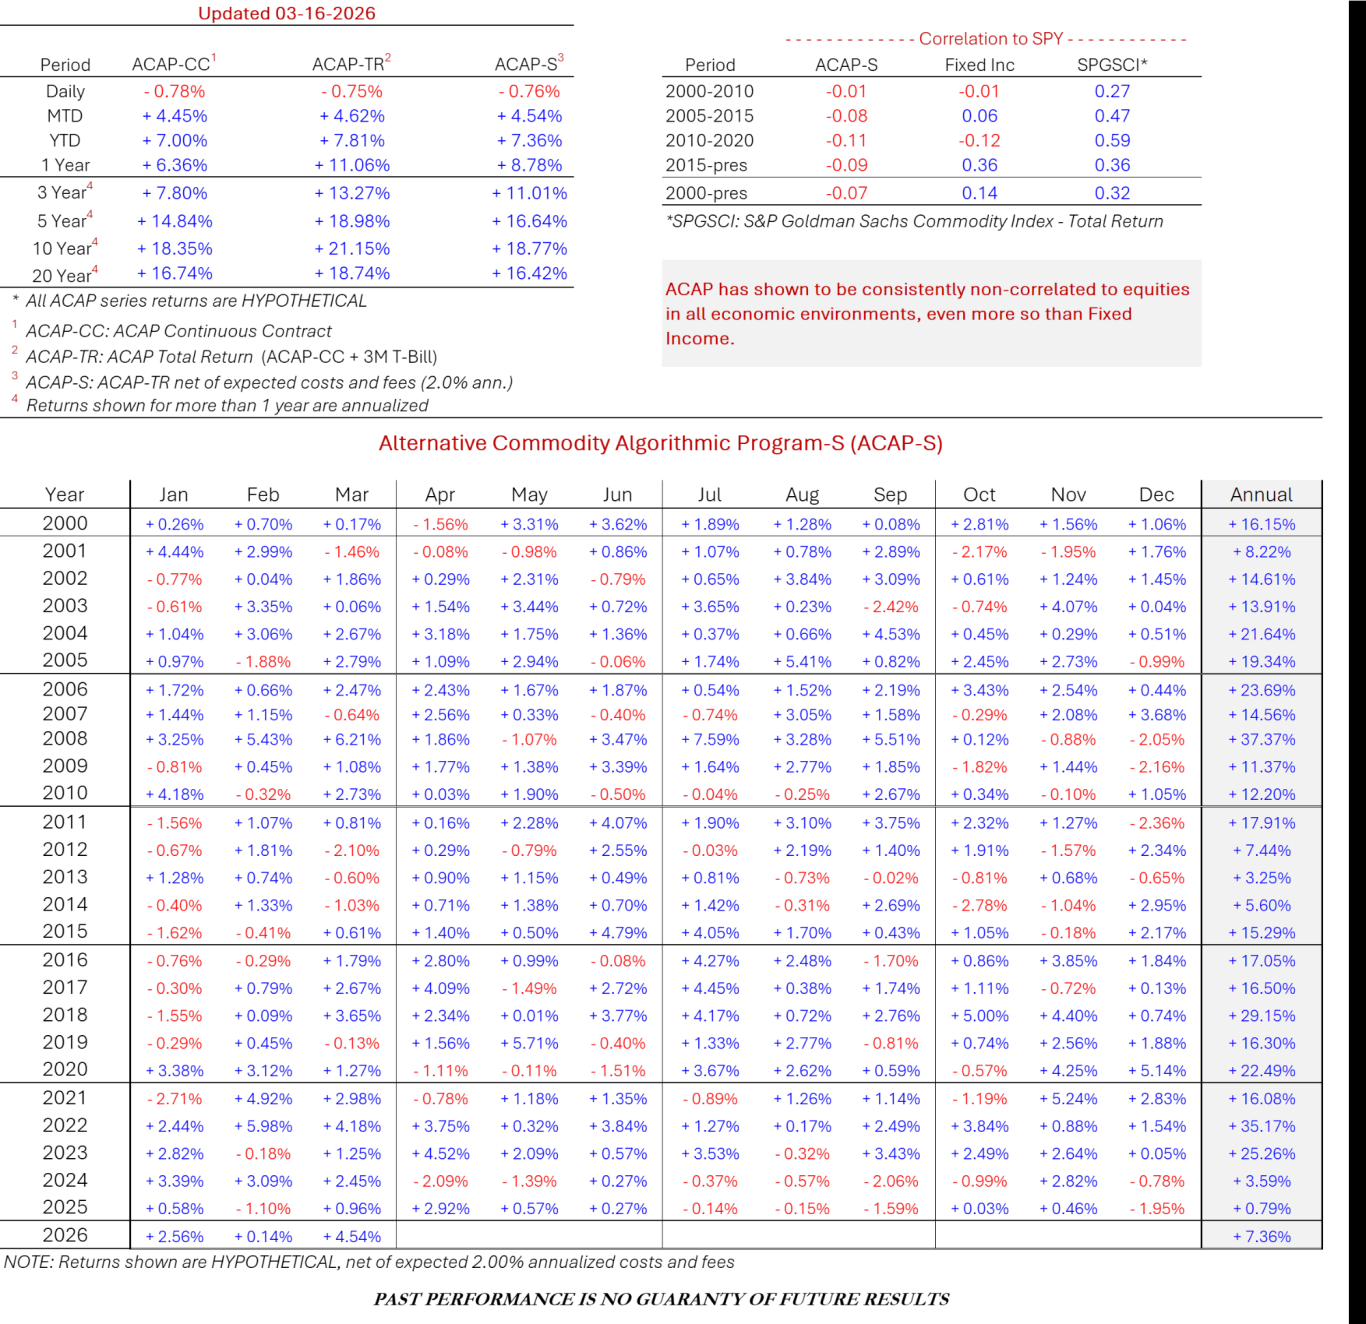
ACAP-S represents the ACAP-Total Return net of estimated costs and fees. ACAP-S allows for a more appropriate comparison versus investable fee-based commodity and managed futures programs.
There is currently $5m benchmarked to ACAP.
ACAP has a proprietary methodology that combines trend, counter-trend, volatility, and seasonality factors to determine monthly long/short/flat positions in 20 highly liquid, US Exchange listed futures markets .
> SCROLL DOWN TO SEE PERFORMANCE TABLES AND DOWNLOADS <
Fixed Methodology
ACAP utilizes a proprietary methodology that combines trend, counter-trend, volatility, and seasonality analysis to determine monthly long/short/flat positions in 20 commodity futures markets.
Highly Liquid
ACAP is comprised of highly liquid, U.S. Exchange listed commodity futures contracts. These contracts represent the main commodity sectors: Grains, Livestock, Metals, Softs, and Energy.
Risk Management
ACAP has built-in risk management procedures. This includes a proprietary risk-parity structured volatility weighting scheme that combines historical seasonal volatility factors with recent price activity.
Diversification
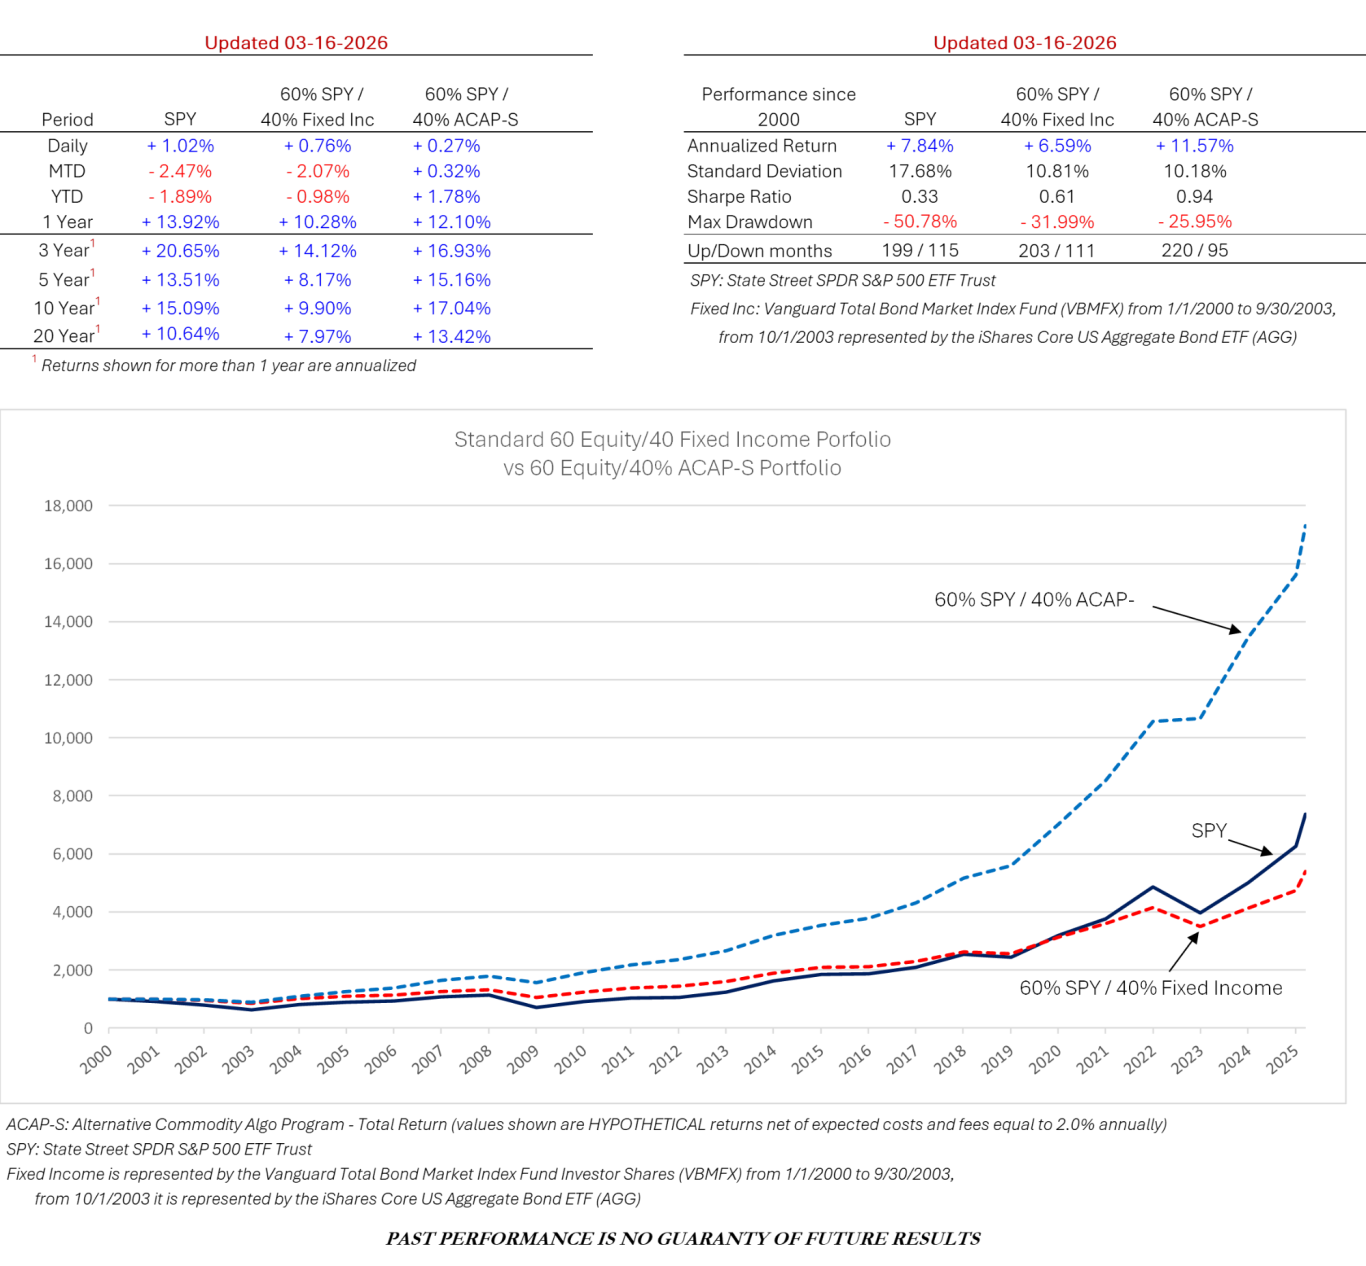
ACAP has shown to provide superior diversification benefits to a core 60/40 equity/fixed income portfolio compared to other investable alternative programs. These include long-only and active commodity-based programs and managed futures.
ACAP Daily Performance
60 Equity /40 ACAP Portfolio
ACAP downloads
ACAP transact only in highly liquid, US Exchange listed futures contracts.
The return derived from exposure to any commodity futures contract is the sum of:
- Change in spot price.
- Roll yield. The roll yield can be either positive or negative. When rolling a long futures position, a backwardated forward curve normally provides a positive return as one is rolling from from a higher priced futures contract into a lower priced futures contract. The opposite is true for a contango (carry) structured forward curve.
- Collateral yield. The collateralized return from interest earned on deposited funds. ACAP uses the the Federal 3-Month Treasury Bill Rate for its hypothetical performance.
The Alternative Commodity Algorithmic Program – Continuous Contract (“ACAP-CC”) return is comprised of the first two types listed above. Since the ACAP-CC is comprised of both long and short positions, the roll yield may be either positive or negative, depending on the position being established for the upcoming period.
Alternative Commodity Algorithmic Program – Total Return (“ACAP”) is comprised of all three types of return listed above.
Alternative Commodity Algorithmic Program – S (“ACAP-S”) is the ACAP less the expected management fee, performance fee, and transaction costs to provide a more representative return for an investor to use when comparing the hypothetical ACAP historical returns versus comparable programs.
.................................................................................................................................................................................................................................
DISCLAIMER
The information on this web site is for illustrative purposes only. Hypothetical results relating to the Alternative Commodity Algorithmic Program (“ACAP©”) do not reflect actual investment results or the trading of an actual account and are achieved by the retroactive application of market and other trading data. Hypothetical results have many inherent limitations, including that they are prepared with the benefit of hindsight. Hypothetical results do not involve financial risk. There are numerous other factors related to the markets in general or to the implementation of any specific trading program which cannot be fully accounted for in preparation of hypothetical results, all of which can adversely affect actual trading results. This presentation is for informational purposes only. Information shown has been prepared by RTM Analytics. This presentation is neither an offer to sell nor a solicitation to purchase any securities, investment product or investment advisory services in any investment fund.
Please read the Privacy Policy for more complete information regarding the limitations of the information displayed on this web site.
PAST PERFORMANCE IS NO GUARANTY OF FUTURE RESULTS