Alternative Commodity Algorithmic Program (ACAP)
ACAP is a proprietary program developed by RTM Analytics. ACAP measures the performance of a program with a transparent long/short/flat methodology that utilizes highly liquid US Exchange listed commodity futures. ACAP has demonstrated consistent non-correlated returns that are additive to a well-structured equity/fixed income portfolio in all economic environments.
ACAP-S is the ACAP-Total Return net of estimated costs associated with management fees and transaction costs. This version of ACAP allows for a more "apples-to-apples" comparison versus comparable investment programs.
Currently, ACAP has been licensed to an established CTA that has $5m benchmarked to the index.
Scroll down for available files for download
Fixed Methodology
ACAP utilizes a proprietary methodology that combines trend, counter-trend, and seasonality analysis to determine monthly long/short/flat positions in 20 commodity futures markets.
Highly Liquid
ACAP is comprised of highly liquid, U.S. Exchange listed commodity futures contracts. These contracts represent the main commodity sectors: Grains, Livestock, Metals, Softs, and Energy.
Risk Management
ACAP has built-in risk management procedures. This includes a proprietary risk-parity structured volatility weighting scheme that combines historical seasonal volatility factors with recent price activity.
Diversification
ACAP has shown to provide superior diversification benefits to a core 60/40 equity/fixed income portfolio compared to other investable alternative programs. These include long-only and active commodity-based programs and managed futures.
ACAP is a long/short/flat algorithmic program that seeks to address the shortcomings of long-only commodity exposures. The ACAP methodology seeks to account for fundamental factors unique to each component commodity and apply these individualized factors into its algorithms.
The ACAP-S returns shown below represent the ACAP-Total Return less expected management fees and transaction costs of 2.00% annually.
Period ACAP-S (updated 7/22/25)
Daily + 0.57%
MTD + 1.99%
YTD + 6.31% _
1 Year + 4.18%
3 Year + 15.12%
5 Year + 20.34%
10 Year + 19.52%
20 Year + 17.15% __________
* Returns greater than 1 year are annualized.
PAST PERFORMANCE IS NO GUARANTY OF FUTURE RESULTS
- Alternative Commodity Algorithmic Program - Strategy (ACAP-S) Historical Returns
Year Jan Feb Mar Apr May Jun Jul Aug Sep Oct Nov Dec Annual - 2000 + 0.26% + 0.70% + 0.17% - 1.56% + 3.31% + 3.62% + 1.89% + 1.28% + 0.08% + 2.81% + 1.56% + 1.06% + 16.15%
- 2001 + 4.44% + 2.99% - 1.46% - 0.08% - 0.98% + 0.86% + 1.07% + 0.78% + 2.89% - 4.76% - 1.95% + 1.76% + 5.35%
- 2002 - 0.77% + 0.04% + 1.85% + 0.31% + 2.31% - 0.79% + 0.65% + 3.84% + 3.09% + 0.61% + 1.24% + 1.45% + 14.61%
- 2003 - 0.61% + 3.35% + 0.06% + 1.54% + 3.44% + 0.72% + 3.65% + 0.23% - 2.42% - 0.74% + 4.07% + 0.04% + 13.91%
- 2004 + 1.04% + 3.06% + 2.67% + 3.18% + 1.73% + 1.37% + 0.37% + 0.66% + 4.53% + 0.45% + 0.29% + 0.51% + 21.64%
- 2005 + 0.97% - 1.88% + 2.79% + 1.09% + 2.94% - 0.06% + 1.74% + 5.41% + 0.82% + 2.45% + 2.73% - 0.99% + 19.34%
- 2006 + 1.72% + 0.66% + 2.47% + 2.43% + 1.67% + 1.87% + 0.54% + 1.52% + 2.19% + 3.43% + 2.54% + 0.44% + 23.69%
- 2007 + 1.44% + 1.15% - 0.64% + 2.56% + 0.33% - 0.40% - 0.74% + 3.05% + 1.58% - 0.29% + 2.08% + 3.68% + 14.56%
- 2008 + 3.25% + 5.43% + 6.21% + 1.86% - 1.07% + 3.47% + 7.59% + 3.28% + 5.51% + 0.12% - 0.88% - 2.05% + 37.37%
- 2009 - 0.81% + 0.45% + 1.08% + 1.77% + 1.38% + 3.39% + 1.64% + 2.77% + 1.85% - 1.82% + 1.44% - 2.16% + 11.37%
- 2010 + 4.18% - 0.32% + 2.73% + 0.03% + 1.89% - 0.48% - 0.04% - 0.25% + 2.67% + 0.34% - 0.10% + 1.05% + 12.20%
- 2011 - 1.56% + 1.07% + 0.81% + 0.16% + 2.28% + 4.07% + 1.90% + 3.10% + 3.75% + 2.32% + 1.27% - 2.36% + 17.91%
- 2012 - 0.67% + 1.81% - 2.10% + 0.29% - 0.79% + 2.55% - 0.03% + 2.19% + 1.40% + 1.91% - 1.57% + 2.34% + 7.44%
- 2013 + 1.28% + 0.74% - 0.62% + 0.92% + 1.15% + 0.49% + 0.81% - 0.73% - 0.02% - 0.81% + 0.68% - 0.65% + 3.25%
- 2014 - 0.40% + 1.33% - 1.03% + 0.71% + 1.38% + 0.70% + 1.42% - 0.31% + 2.69% - 2.78% - 1.04% + 2.95% + 5.60%
- 2015 - 1.62% - 0.41% + 0.61% + 1.40% + 0.50% + 4.79% + 4.05% + 1.70% + 0.43% + 1.05% - 0.18% + 2.17% + 15.29%
- 2016 - 0.76% - 0.29% + 1.79% + 2.80% + 0.99% - 0.08% + 4.27% + 2.48% - 1.70% + 0.86% + 3.85% + 1.84% + 17.05%
- 2017 - 0.30% + 0.79% + 2.67% + 4.09% - 1.49% + 2.72% + 4.45% + 0.38% + 1.74% + 1.11% - 0.72% + 0.13% + 16.50%
- 2018 - 1.55% + 0.09% + 3.64% + 2.36% + 0.01% + 3.77% + 4.17% + 0.72% + 2.76% + 5.00% + 4.40% + 0.74% + 29.15%
- 2019 - 0.29% + 0.45% - 0.13% + 1.56% + 5.71% - 0.40% + 1.33% + 2.77% - 0.81% + 0.74% + 2.56% + 1.88% + 16.30%
- 2020 + 3.38% + 3.12% + 1.27% - 1.11% - 0.11% - 1.51% + 3.67% + 2.62% + 0.59% - 0.57% + 4.25% + 5.14% + 22.49%
- 2021 - 2.71% + 4.92% + 2.98% - 0.78% + 1.16% + 1.37% - 0.89% + 1.26% + 1.14% - 1.19% + 5.24% + 2.83% + 16.08%
- 2022 + 2.44% + 5.98% + 4.18% + 3.75% + 0.32% + 3.84% + 1.27% + 0.17% + 2.49% + 3.84% + 0.88% + 1.54% + 35.17%
- 2023 + 2.82% - 0.18% + 1.25% + 4.52% + 2.09% + 0.57% + 3.53% - 0.32% + 3.43% + 2.49% + 2.64% + 0.05% + 25.26%
- 2024 + 3.39% + 3.09% + 2.43% - 2.08% - 1.39% + 0.27% - 0.37% - 0.57% - 2.06% - 0.99% + 2.82% - 0.78% + 3.59%
- 2025 + 0.58% - 1.10% + 0.96% + 2.92% + 0.57% + 0.26% + 1.99% + 6.31%
NOTE: Returns shown are HYPOTHETICAL, NET of expected management fees and transaction costs equal to 2.00%/year.
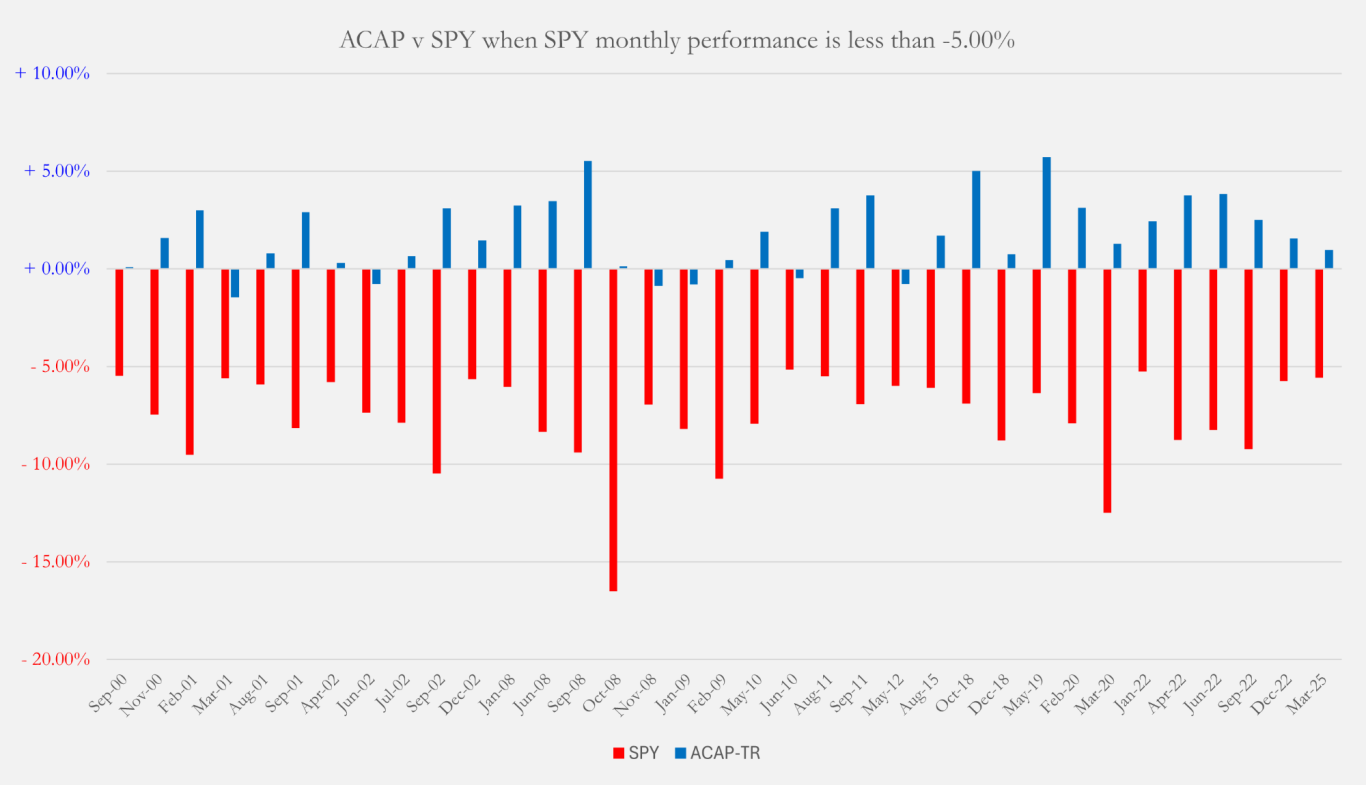
ACAP vs SPY during SPY -5.00% months
Since 2000, SPY has experienced 35 months where it was down -5.00% or more. During these periods, ACAP was up in 29 of those periods. SPY was down a total of -268% in those 35 months while ACAP was up 209% for the same periods.
....
DISCLAIMER
The information on this web site is for illustrative purposes only. Hypothetical results relating to the Alternative Commodity Algorithmic Program (“ACAP©”) do not reflect actual investment results or the trading of an actual account and are achieved by the retroactive application of market and other trading data. Hypothetical results have many inherent limitations, including that they are prepared with the benefit of hindsight. Hypothetical results do not involve financial risk. There are numerous other factors related to the markets in general or to the implementation of any specific trading program which cannot be fully accounted for in preparation of hypothetical results, all of which can adversely affect actual trading results. This presentation is for informational purposes only. Information shown has been prepared by RTM Analytics. This presentation is neither an offer to sell nor a solicitation to purchase any securities, investment product or investment advisory services in any investment fund.
Please read the Privacy Policy for more complete information regarding the limitations of the information displayed on this web site.
PAST PERFORMANCE IS NO GUARANTY OF FUTURE RESULTS